Menu
×
   ❮     
HTML CSS JAVASCRIPT SQL PYTHON JAVA PHP HOW TO W3.CSS C C++ C# BOOTSTRAP REACT MYSQL JQUERY EXCEL XML DJANGO NUMPY PANDAS NODEJS R TYPESCRIPT ANGULAR GIT POSTGRESQL MONGODB ASP AI GO KOTLIN SASS VUE DSA GEN AI SCIPY CYBERSECURITY DATA SCIENCE
     ❯   

Python Tutorial

Python HOME Python Intro Python Get Started Python Syntax Python Comments Python Variables Python Data Types Python Numbers Python Casting Python Strings Python Booleans Python Operators Python Lists Python Tuples Python Sets Python Dictionaries Python If...Else Python While Loops Python For Loops Python Functions Python Lambda Python Arrays Python Classes/Objects Python Inheritance Python Iterators Python Polymorphism Python Scope Python Modules Python Dates Python Math Python JSON Python RegEx Python PIP Python Try...Except Python User Input Python String Formatting

File Handling

Python File Handling Python Read Files Python Write/Create Files Python Delete Files

Python Modules

NumPy Tutorial Pandas Tutorial SciPy Tutorial Django Tutorial

Python Matplotlib

Matplotlib Intro Matplotlib Get Started Matplotlib Pyplot Matplotlib Plotting Matplotlib Markers Matplotlib Line Matplotlib Labels Matplotlib Grid Matplotlib Subplot Matplotlib Scatter Matplotlib Bars Matplotlib Histograms Matplotlib Pie Charts

Machine Learning

Getting Started Mean Median Mode Standard Deviation Percentile Data Distribution Normal Data Distribution Scatter Plot Linear Regression Polynomial Regression Multiple Regression Scale Train/Test Decision Tree Confusion Matrix Hierarchical Clustering Logistic Regression Grid Search Categorical Data K-means Bootstrap Aggregation Cross Validation AUC - ROC Curve K-nearest neighbors

Python MySQL

MySQL Get Started MySQL Create Database MySQL Create Table MySQL Insert MySQL Select MySQL Where MySQL Order By MySQL Delete MySQL Drop Table MySQL Update MySQL Limit MySQL Join

Python MongoDB

MongoDB Get Started MongoDB Create DB MongoDB Collection MongoDB Insert MongoDB Find MongoDB Query MongoDB Sort MongoDB Delete MongoDB Drop Collection MongoDB Update MongoDB Limit

Python Reference

Python Overview Python Built-in Functions Python String Methods Python List Methods Python Dictionary Methods Python Tuple Methods Python Set Methods Python File Methods Python Keywords Python Exceptions Python Glossary

Module Reference

Random Module Requests Module Statistics Module Math Module cMath Module

Python How To

Remove List Duplicates Reverse a String Add Two Numbers

Python Examples

Python Examples Python Compiler Python Exercises Python Quiz Python Server Python Syllabus Python Study Plan Python Interview Q&A Python Bootcamp Python Certificate

Matplotlib Line


Linestyle

You can use the keyword argument linestyle, or shorter ls, to change the style of the plotted line:

Example

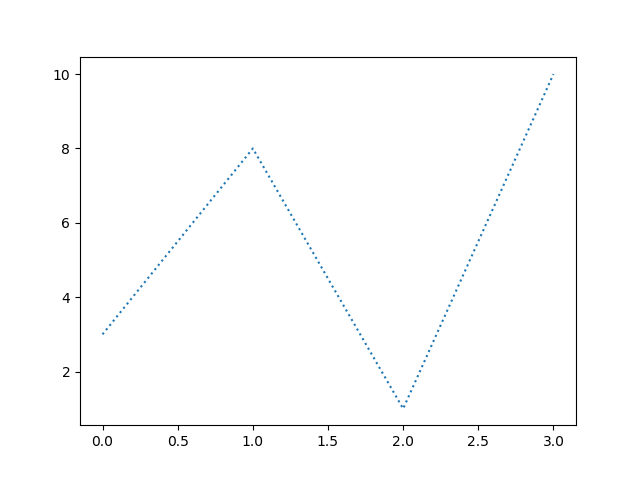
Use a dotted line:

import matplotlib.pyplot as plt
import numpy as np

ypoints = np.array([3, 8, 1, 10])

plt.plot(ypoints, linestyle = 'dotted')
plt.show()

Result:
Try it Yourself »

Example

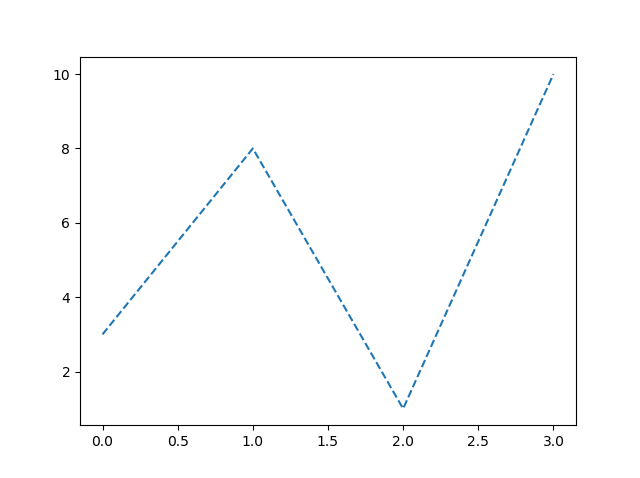
Use a dashed line:


plt.plot(ypoints, linestyle = 'dashed')

Result:

Try it Yourself »


Shorter Syntax

The line style can be written in a shorter syntax:

linestyle can be written as ls.

dotted can be written as :.

dashed can be written as --.

Example

Shorter syntax:

plt.plot(ypoints, ls = ':')

Result:

Try it Yourself »

Line Styles

You can choose any of these styles:

Style Or
'solid' (default) '-' Try it »
'dotted' ':' Try it »
'dashed' '--' Try it »
'dashdot' '-.' Try it »
'None' '' or ' ' Try it »

Line Color

You can use the keyword argument color or the shorter c to set the color of the line:

Example

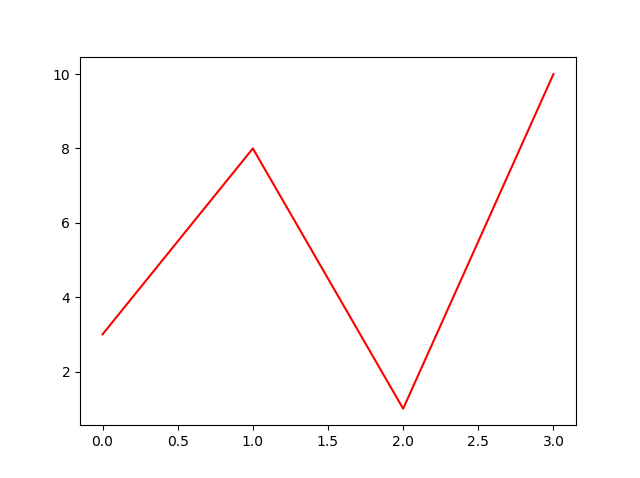
Set the line color to red:

import matplotlib.pyplot as plt
import numpy as np

ypoints = np.array([3, 8, 1, 10])

plt.plot(ypoints, color = 'r')
plt.show()

Result:
Try it Yourself »

You can also use Hexadecimal color values:

Example

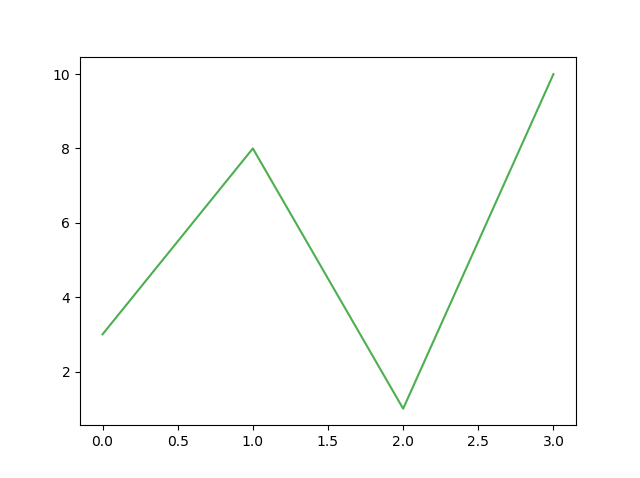
Plot with a beautiful green line:

...
plt.plot(ypoints, c = '#4CAF50')
...

Result:
Try it Yourself »

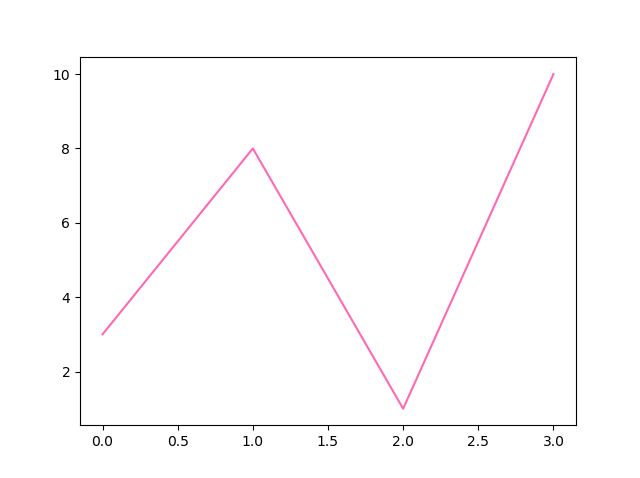
Or any of the 140 supported color names.

Example

Plot with the color named "hotpink":

...
plt.plot(ypoints, c = 'hotpink')
...

Result:
Try it Yourself »

Line Width

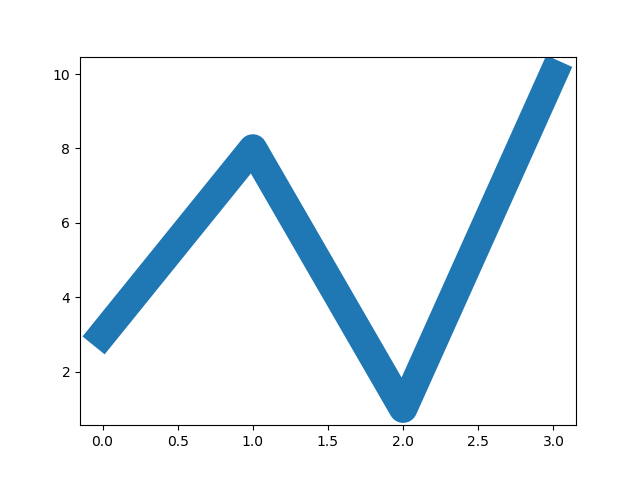
You can use the keyword argument linewidth or the shorter lw to change the width of the line.

The value is a floating number, in points:

Example

Plot with a 20.5pt wide line:

import matplotlib.pyplot as plt
import numpy as np

ypoints = np.array([3, 8, 1, 10])

plt.plot(ypoints, linewidth = '20.5')
plt.show()

Result:
Try it Yourself »

Multiple Lines

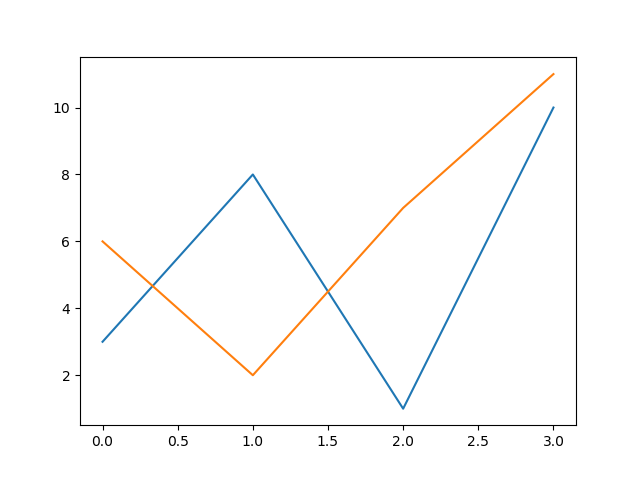
You can plot as many lines as you like by simply adding more plt.plot() functions:

Example

Draw two lines by specifying a plt.plot() function for each line:

import matplotlib.pyplot as plt
import numpy as np

y1 = np.array([3, 8, 1, 10])
y2 = np.array([6, 2, 7, 11])

plt.plot(y1)
plt.plot(y2)

plt.show()

Result:
Try it Yourself »

You can also plot many lines by adding the points for the x- and y-axis for each line in the same plt.plot() function.

(In the examples above we only specified the points on the y-axis, meaning that the points on the x-axis got the the default values (0, 1, 2, 3).)

The x- and y- values come in pairs:

Example

Draw two lines by specifiyng the x- and y-point values for both lines:

import matplotlib.pyplot as plt
import numpy as np

x1 = np.array([0, 1, 2, 3])
y1 = np.array([3, 8, 1, 10])
x2 = np.array([0, 1, 2, 3])
y2 = np.array([6, 2, 7, 11])

plt.plot(x1, y1, x2, y2)
plt.show()

Result:

Try it Yourself »