Run ❯
Get your
own
website
❯
Run Code
Ctrl+Alt+R
Change Orientation
Ctrl+Alt+O
Change Theme
Ctrl+Alt+D
Go to Spaces
Ctrl+Alt+P
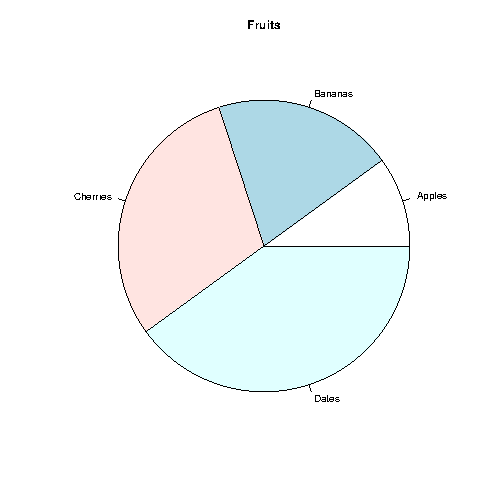
# We need this line of code to show graphs in our compiler bitmap(file="out.png") # Create a vector of pies x <- c(10,20,30,40) # Create a vector of labels mylabel <- c("Apples", "Bananas", "Cherries", "Dates") # Display the pie chart pie(x, label = mylabel, main = "Fruits")